Windows Kernel Debugging & Exploitation Part1 – Setting up the lab
Recently I was thrilled with the opportunity to build a PoC for ms-14-066 vulnerability aka “winshock” (CVE-2014-6321). While that will be material for another blog post, in order to debug the vulnerability, I had to set up a lab with windows kernel mode debugging enabled. So, without any further ado, here my setup and the steps used in order to enable Windows Kernel Debug.
Table of Contents
Setup
Host system: Windows 10 with VMware Workstation 15.1.0 (build-13591040)
Guest systems:
- Windows 7 x86 ultimate sp1 (debugger)
- Windows 7 x86 ultimate sp1 (debuggee, using UART as debugging medium)
Debuggee: a process or application upon which a debugger acts; the process that is being debugged.
Setting up the VMs
Install, as usual, one Windows 7 x86 in a newly created VM (also install VMware Tools).
Now that OS in the first machine has been installed, make a clone of it (Right Click on VM -> Manage -> Clone) I’ve used the “Full clone” option but it should also works fine with a “Linked Clone”.
Now you should have two identical machines.
Setting up the Serial Port
VMware machines already have a serial port (used for the printer), since we do not need it, we will remove the hardware from the configuration. In order to do so:
- Right click on VM -> Open VM directory
- Select the corresponding VMX file and open it with notepad
- Remove the lines beginning with serial0
Serial Port Configuration – Debugger
Paste the following lines inside the VMX debugger configuration file:
serial0.fileType = "pipe"
serial0.yieldOnMsrRead = "TRUE"
serial0.fileName = "\\.\pipe\KernelDbg"
serial0.present = "TRUE"
serial0.tryNoRxLoss = "TRUE"
Save and close the file. At the end of this procedure you should have the following hardware in the Debugger VM configuration.
Serial Port Configuration – Debuggee
Paste the following lines inside the VMX debuggee configuration file:
serial0.present = "TRUE"
serial0.fileType = "pipe"
serial0.yieldOnMsrRead = "TRUE"
serial0.fileName = \\.\pipe\KernelDbg
serial0.pipe.endPoint = "client"
serial0.tryNoRxLoss = "TRUE"
Save and close the file. At the end of this procedure you should have the following hardware in the Debuggee VM configuration.
Do NOT forget to select the Yield CPU on poll check box, as the kernel in the target virtual machine uses the virtual serial port in polled mode, not interrupt mode.
Setting up the Serial Port in Windows
Fire up both your machines and check that the serial port is connected using the named pipe: \\.\pipe\KernelDbg
 Setting up COM port
Once Windows is up and running log into the machines as Administrator:
- Start Bar Button
- Right click on Computer.
- Click on Manage.
- Computer Management should open.
- Click on the Device Manager button.
- Expand the Ports (COM & LPT) tree item.
- Right click on the COM port and choose Properties.
- Click on the Port Settings tab.
- Choose Bits per second Baud Rate: 115200.
- Choose 8 data bits.
- Parity: None.
- Stop bits: 1.
- Flow control: None.
- Click Ok and close all the dialogs.
Setting Up the Debugger Environment
Installing WinDbg is trivial but is also something that will waste our time (Windows SDK, Updates etc); since its installation can be automatized, I will recommend to install WinDbg via Chocolatey. From an elevated PowerShell launch the following command:
Set-ExecutionPolicy Bypass -Scope Process -Force; iex ((New-Object System.Net.WebClient).DownloadString('https://chocolatey.org/install.ps1'))choco install -y --force windbg
It will take a bit; go grab a coffee :D
Setting up symbols on Debugger
Microsoft provides redacted symbols for their software releases. This includes kernel components, to leverage this useful information, we’ll need to setup WinDbg so it can access these resources.
Locate WinDbg shortcut -> right click on the shortcut -> select “Properties” and in the “Shortcut” tab you should see something similar:
Select the “Target” text field and append the following string:
-y "srv*c:\symbols*https://msdl.microsoft.com/download/symbols"
This will download all available symbols from the Microsoft Symbol Server to your local directory at c:\symbols. If you prefer to place your downloaded symbols somewhere else choose another local path instead.
Save your shortcut by clicking ‘OK’.
Let’s test WinDbg to ensure that everything is working fine:
- Run the shortcut and a copy of the pre-installed application Calc.exe
- Select “File” -> “Attach to a Process…” (or hit F6) in WinDbg. Scroll down all the way and select “calc.exe” from your process list. Then hit ‘OK’.
Let’s try to load symbols for all the running modules (executable and DLLs). First, let’s list what modules are currently loaded in our process by using the lm (list modules) command in the text box immediately to the right of “>” ( bottom left corner of the “Command” window):
It should look something like this, anyway if your list looks different from mine, don’t worry. Different versions of Windows and different versions of Calc will have different modules loaded.
Next, let’s force a symbol load of all modules within our process by executing: .reload /f.
To access WinDbg manual, you can type the command
.hhwithin the debugger (or select “Help” and then “Search” from the menu bar). Typing.hh search_termsautomatically runs a search for the user supplied argument..hh .reloaddocuments the.reloadcommand.
WinDbg will took few moments to load all symbol information. You can see the status of WinDbg in the bottom left corner. After WinDbg has loaded symbols, run the lm command again (If WinDbg stays “BUSY” for a long time, you can force it to stop its current task by pushing CTRL+Break on your keyboard or by selecting “Debug” and then Break” from the menu bar).
As you can see, most modules now have a local symbol path listed to the right of their module names. It’s very possible that there may be some modules that still do not have symbols loaded; these modules are most likely not distributed by Microsoft (e.g. 3rd party antivirus vendors).
For validation, go to the directory that you’ve setup for your local symbol cache, e.g. C:\symbols. If the folder contains data your setup is working.
Lazy Fix
If for some reason, the above steps failed, WinDbg may be able to fix automagically the problems for you if you issue .symfix and then .reload /f. In this case, WinDbg will alter your symbol path to the Microsoft Symbol Server. Your downloaded symbols will be stored (locally) in WinDbg’s current working directory (C:\Program Files (x86)\Windows Kits\10\Debuggers\x64) or C:\ProgramData\dbg.
Kernel Debugging with WinDbg
Manually configure WinDbg each time for kernel debugging is boring. So, we can configure it in the shortcut. You can append the following line to the “Target” textbox:
-k com:port=com1,baud=115200
Hit ‘OK’ and you should be all set. Now when you run this shortcut of WinDbg, it will correctly configure your symbol path (without having to use environment variables) and will automatically start kernel debugging on COM1 port.
So, launch our WinDbg in kernel mode following the newly created shortcut or launch WinDbg, press CTRL+K and the following widow will pop-out:
Set the COM tab as above and press “OK”.
Setting Up the Debuggee Environment via Serial Port (or UART)
To enable Kernel Debugging, open cmd.exe as Administrator, and add another entry to the boot loader using bcdedit utility:
bcdedit /copy {current} /d "Windows 7 with kernel debug via COM"
Then enable debug mode on new entry UUID:
bcdedit /debug {UUID-RETURNED-BY-PRECEDENT-COMMAND} on
Note: graph parentheses are needed for the above command
Now instruct Windows serial communication as debugging medium and use the “fastest” baudrate (i.e 115200 symbols/sec). Since we’ll only use serial debugging for this VM, we can use the bcdedit /dbgsettings global switch.
bcdedit /dbgsettings serial debugport:1 baudrate:115200
You can add the /noumex switch to the dbgsettings command to avoids user mode exceptions from causing the system to break into the kernel debugger. e.g. bcdedit /dbgsettings serial debugport:1 baudrate:115200 /noumex.
Note: if we wanted to set debug settings specific to one entry of the boot loader, we would’ve used bcdedit /set instead. e.g: bcdedit /set {UUID-RETURNED-BY-PRECEDENT-COMMAND} debugtype serial
Now validate that the settings have been successfully applied:
bcdedit /dbgsettingsbcdedit
You should see similar command prompt output to this:
Note that debug parameter must be turned to Yes for the “Windows 7 kernel debug via COM” entry.
Now, from Start bar button or with Win+R key combination, launch “msconfig” in the dialog box. You will access certain Windows startup configurations. In the “Boot” tab, make sure to have the following configuration:
Now the next step is to restart the Debuggee VM and boot up in Kernel Debug mode:
ALWAYS make sure to have the Debugger VM with WinDbg started and listening for connection in kernel mode before firing up the Debuggee VM.
If everything worked up correctly, the following screen should show up in the Debugger VM in WinDbg:
We won’t be able to interact with the virtual machine until we stop it running at an instruction. To do that, press “Ctrl+Pause” (or “Debug -> Break” menu). If we go to the virtual machine, we can now see that it is frozen, and we cannot move the mouse or obtain a response from the keyboard. This is normal, given that the VM is stopped at an instruction. From the last line, we can see that execution of the instructions has been stopped by using an INT 3, which has been stopped in the kernel’s memory. Below that is the console with which we can start to send commands to WinDbg.
Just to be sure that the symbols have been loaded correctly, run the following commands:
!sym noisy.reload /f
Troubleshooting
Sometimes happens that while firing-up the Debuggee VM it stuck at the “Starting Windows” screen with WinDbg in the Debugger VM not receiving anything.
In this case I will suggest to close WinDbg and load it again, it immediately gets the connection from the Debuggee VM and Windows will start loading till the end.
You’re now debugging the Windows 7 x86 VM kernel! But as you’ll see, Serial Port debugging will drastically slow down all operations on the debuggee. Therefore, projects like VirtualKD came to life.
More Windows Debuggee Flavours
If the debuggee VM is a Windows 8 or later, there is faster debugging method (Network based), as detailed below.
When preparing the VM, make sure to add an extra Network Card as Host-Only, and linked to the same interface as the one specified on the host. Important note: if using VBox, in the “Advanced” section, select one of the Intel Pro card (preferably PRO/1000 MT Desktop). The reason for that is that Windows network kernel debugging does not work with all network controllers.
Boot the VM, and then open the “Device Manager” (Control Panel -> System -> Advanced system settings -> on the Hardware tab). Expand “Network adapters” and select the 2nd device’s properties menu. On the new window, the “Location” field will be required to assign this interface for debugging:
This indicates us the bus parameters we will need to provide bcdedit later on, with the format <BusNumber>:<DeviceNumber>:<FunctionNumber> (in this case 0.8.0).
Now open an administrator prompt and use bcdedit utility to create a new entry to the boot manager like we did on Windows 7 and enable the debug mode for it. But unlike Windows 7, now we have to setup the network properties:
bcdedit /dbgsettings net hostip:ip-of-debugger-vm port:50000 key:Kernel.Debugging.Is.Funbcdedit /set {dbgsettings} busparams <BusNumber>.<DeviceNumber>.<FunctionNumber>
Running the debugging session
On the debugger
Start the debugger VM first and prepare WinDBG for kernel-mode debugging (Ctrl-K) by selecting NET as debug vector and set the Port and Key adequately. WinDBG will then be waiting for new connection.
On the debuggee
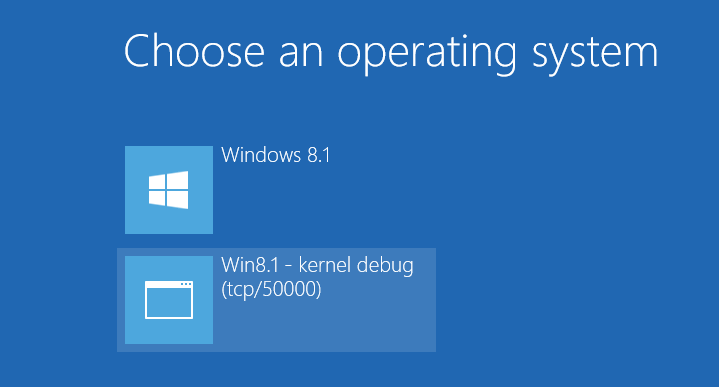
Start the VM, when the boot loader menu shows up, select the one with the network kernel mode enabled.
The debugger will show some activity.
Windows XP
Since bcdedit does not exist on Windows XP in order to enable kernel debugging, you must alter the boot.ini file. The easiest way to do this is by clicking on Start and then Run (Start+R). Enter C:\boot.ini and hit ‘OK’.
Append the string /debug /debugport=COM1 /baudrate=115200 to the end of the first entry in the [operating systems] section.
Save the boot.ini via “File” and then “Save” from the menu bar, close the file and shutdown Windows.
Conclusion
Hopefully this article helped you setting up your Windows Kernel Debugging. If you encounter any issues you can reach me on Twitter or send me an email.
Stay tuned because in the next part we will dive into ms-14-066 vulnerability aka “winshock” (CVE-2014-6321) and I’ll try to build a PoC for it.