Windows Drivers Reverse Engineering Methodology
With this blog post I’d like to sum up my year-long Windows Drivers research; share and detail my own methodology for reverse engineering (WDM) Windows drivers, finding some possible vulnerable code paths as well as understanding their exploitability. I’ve tried to make it as “noob-friendly” as possible, documenting all the steps I usually perform during my research and including a bonus exercise for the readers.
Table of Contents
Setting up the lab
While in the past, setting up a lab for kernel debugging was a pain of pipes, baud, slowness, and weird VMware configurations, nowadays it is pretty easy, it’s just a matter of having two machines:
- Debugger: physical Windows OS machine with the latest version of WinDbg Preview installed (legacy WinDbg will be ok too).
- Debuggee: a copy of Windows OS installed on your preferred virtual machine flavour (VMware, Hyper-V, VirtualBox); NAT or bridge network configuration is fine.
Debug Symbols
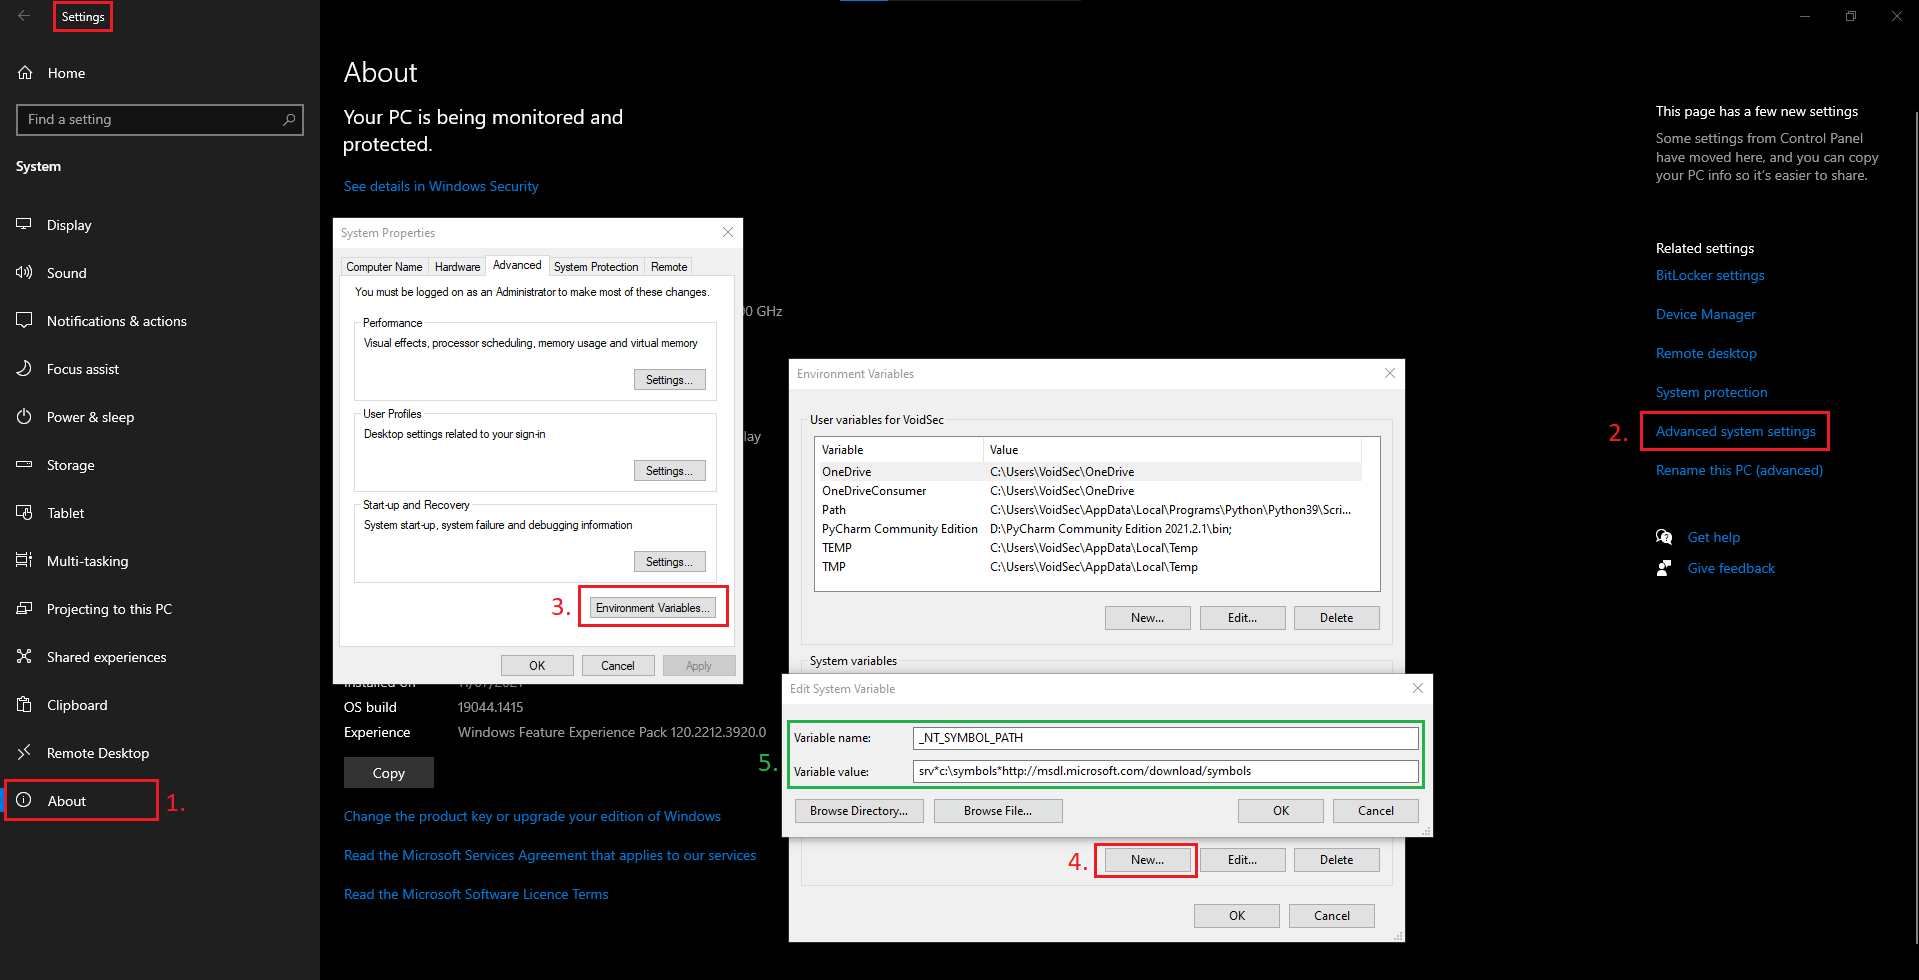
- On the debugger machine, create a new system environment variable called
_NT_SYMBOL_PATH. - Set the value of this new variable to
srv*c:\symbols*http://msdl.microsoft.com/download/symbols.
Make sure there are no leading/trailing spaces.
- Reboot the machine.
- Open WinDbg, load “calc.exe” and in the WinDbg command bar type the following:
x kernel32!IoCallDriver
x ntdll!*alloc*
!peb
Wait for command output; it depends on your internet connection speed as the above commands will trigger the download of symbols for kernel32 and ntdll DLLs.
Check that the !peb command is reporting back some meaningful output (no error message).
The output should be something along this line:

Remote Kernel Debugging
Retrieve the IP of the Debugger machine and note it down (ipconfig /all).
Debuggee – Setup Remote Kernel Debugging
- In an admin command prompt run the following command:
bcdedit /dbgsettings NET HOSTIP:<DEBUGGER_IP> PORT:50000
Example – setting the Debugger machine IP address: bcdedit /dbgsettings NET HOSTIP:192.168.1.1 PORT:50000
- Run
bcdedit /dbgsettings; confirm the settings and copy the “key” value. - Run
bcdedit /debug onto enable debugging. You should get back the “The operation completed successfully” message. - Shut down the Debuggee machine.

Debugger – Attempt to Connect
- Open WinDbg.
- Configure WinDbg to listen for a remote kernel debugging connection: “File -> Attach to Kernel -> Net tab”; configure as follows:
Port: 50000
Key: <insert the key taken from the debuggee machine>
Target: <leave blank>
Click OK
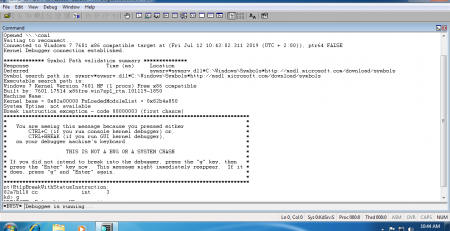
 The result should be a debug message along this line:
Using NET for debugging
Opened WinSock 2.0
Waiting to reconnect...
- Start-up the Debuggee VM.
- Wait for WinDbg to show something like the following message:
Connected to target 192.168.1.9 on port 50000 on local IP 192.168.1.1.
You can get the target MAC address by running .kdtargetmac command.
Connected to Windows 10 18362 x64 target at (Wed Dec 15 10:53:59.166 2021 (UTC + 1:00)), ptr64 TRUE
Kernel Debugger connection established.

************* Path validation summary **************
Response                         Time (ms)     Location
Deferred                                       srv*
Deferred                                       srv*c:\symbols*http://msdl.microsoft.com/download/symbols
Symbol search path is: srv*;srv*c:\symbols*http://msdl.microsoft.com/download/symbols
Executable search path is:
Windows 10 Kernel Version 18362 MP (2 procs) Free x64
Product: WinNt, suite: TerminalServer SingleUserTS
Edition build lab: 18362.1.amd64fre.19h1_release.190318-1202
Machine Name:
Kernel base = 0xfffff804`06000000 PsLoadedModuleList = 0xfffff804`06443290
Debug session time: Wed Dec 15 10:53:58.578 2021 (UTC + 1:00)
System Uptime: 0 days 0:00:35.310
KDTARGET: Refreshing KD connection
Debugger – Test the Connection
- In WinDbg click “Break”. The usual
“*BUSY* Debuggee is running...”message should be replaced with a command prompt“0: kd>”. - Run
.reloadto load the MS Symbols. (It will take some time). - Once the precedent command has finished, run the
lmcommand and you should get back a list of modules (drivers) loaded on the Debuggee.
0: kd> .reload
Connected to Windows 10 18362 x64 target at (Wed Dec 15 11:13:08.268 2021 (UTC + 1:00)), ptr64 TRUE
Loading Kernel Symbols
.......

Press ctrl-c (cdb, kd, ntsd) or ctrl-break (windbg) to abort symbol loads that take too long.
Run !sym noisy before .reload to track down problems loading symbols.

........................................................
................................................................
.................................................
Loading User Symbols

Loading unloaded module list
...Unable to enumerate user-mode unloaded modules, Win32 error 0n30
0: kd> lm
start             end                 module name
ffffc79c`2bc00000 ffffc79c`2bfa7000   win32kfull   (deferred)
ffffc79c`2bfb0000 ffffc79c`2c264000   win32kbase   (deferred)
ffffc79c`2c270000 ffffc79c`2c2b8000   cdd        (deferred)
ffffc79c`2c2d0000 ffffc79c`2c35c000   win32k     (deferred)
fffff804`05f5d000 fffff804`06000000   hal        (deferred)
fffff804`06000000 fffff804`06ab2000   nt         (pdb symbols)          C:\ProgramData\Dbg\sym\ntkrnlmp.pdb\35A038B1F6E2E8CAF642111E6EC66F571\ntkrnlmp.pdb
[--SNIP--]
Windows Driver 101
A driver is a piece of software (module) that interacts with the kernel and/or controls hardware resources. One can think of a driver as a DLL, loaded into the kernel address space, and executed with the same privilege as the kernel.
DriverEntry
Drivers have a well-defined entry point called DriverEntry. They do not have a main execution thread and they simply contain code that can be called by the kernel under certain circumstances. For this reason, drivers usually have to register “Dispatch Routines” within the I/O manager to service requests from user-land or other drivers.
When analysing drivers, the first and most important task is to identify these dispatch routines and understand how they interact with the kernel.
Devices & Symlinks
In order to be accessed from user mode, a driver has to create a DeviceName and a symbolic link. Devices are interfaces that let processes interact with the driver while Symlink is an alias you can use while calling Win32 functions.
IoCreateDevicecreates DeviceNames:\Device\VulnerableDeviceIoCreateSymbolicLinkcreates Symlinks:\\.\VulnerableDevice
While reverse engineering a driver, when you’ll see these two APIs being called in close succession, you can be sure you are looking at the portion of the driver where it instantiates device and symlink. Most of the time it happens only once, as most drivers expose only one device.
Dispatch Routines
Drivers execute different routines based on the Windows API that’s called on the device they expose. This behaviour is controlled by the driver developer through the MajorFunctions (an array of function pointers) member of the DriverObject structure.
APIs like WriteFile, ReadFile and DeviceIoControl have a corresponding index inside MajorFunctions so that the relevant function pointer is invoked after the API function call.
Let’s say a driver developer has defined a function called “MyDriverRead” and he wants it called when a process calls the ReadFile API on the driver’s device. Inside DriverEntry (or in a function called by it) he had to write the following code:
DriverObject->MajorFunctions[IRP_MJ_READ] = MyDriverRead;
With this statement, the driver developer ensures that every time the ReadFile API is called on the driver’s device, the “MyDriverRead” function is called by the driver code. Functions like this take the name of Dispatch Routines.
As MajorFunctions is an array with a limited size, there are only so many dispatch routines we can assign to our driver. When a developer wants more freedom the user-mode function DeviceIoControl comes to the rescue.
DeviceIoControl & IOCTL Codes
There is a specific index inside MajorFunctions defined as IRP_MJ_DEVICE_CONTROL. At this index, the function pointer of the dispatch routine (invoked after the DeviceIoControl API call on the driver’s device), is stored. This function is very important because one of its arguments is a 32-bit integer known as I/O Control Code (IOCTL).
This I/O code is passed to the driver and makes it executes different routines based on the different IOCTLs that are passed to it through the DeviceIoControl API. Essentially, the dispatch routine at index IRP_MJ_DEVICE_CONTROL will, at some point in its code, act like this switch case:
switch(IOCTL)
{
    case 0xDEADBEEF:
        DoThis();
        break;
    case 0xC0FFEE;
        DoThat();
        break;
    case 0x600DBABE;
    DoElse();
    break;
}
In this way, a developer can make his driver calls different functions depending on the different IOCTL codes passed to the driver.
This kind of “code fingerprint” is very easy to look for and find while reverse engineering a driver. Knowing which IOCTL leads to which code path makes it easier to analyse and/or fuzz a driver while looking for vulnerabilities.
IOCTL codes are composed of several values that can be decoded by shifting and masking its bits:
IOCTL Value: 0x226003
Target Device:			UNKNOWN (0x22)
Target Function: 		0x800
Access Mode: 			FILE_READ_ACCESS
Communication Method: 	METHOD_NEITHER
- Target Device: This value must match the value that is set in the
DeviceTypemember of the driver’sDEVICE_OBJECTstructure. - Target Function: Identifies the function to be performed by the driver.
- Access Mode: Indicates the type of access that a caller must request when opening the file object that represents the device. It can have one of the following system-defined constants:
FILE_ANY_ACCESS: The I/O manager sends the IRP for any caller that has a handle to the file object that represents the target device object, regardless of the access granted to the device.FILE_READ_DATA: The I/O manager sends the IRP only for a caller with read access rights.FILE_WRITE_DATA: The I/O manager sends the IRP only for a caller with write access rights.FILE_READ_DATAandFILE_WRITE_DATAORred together.Drivers can also useIoValidateDeviceIoControlAccessto perform stricter access (ACL) checking.
- Communication Method: Indicates how the system will pass data between the caller of
DeviceIoControland the driver that handles the IRP. It can have one of the following system-defined constants:METHOD_BUFFERED: is typically used for transferring small amounts of data per request.METHOD_IN_DIRECTorMETHOD_OUT_DIRECT: is typically used for reading or writing large amounts of data that must be transferred quickly.METHOD_NEITHER: The I/O manager does not provide any system buffers nor performs any kind of validation of the buffer provided. The IRP supplies the user-mode virtual addresses of the input and output buffers that were specified toDeviceIoControlwithout validating or mapping them. It is the most insecure communication method.
Windows Driver Reverse Engineering Methodology
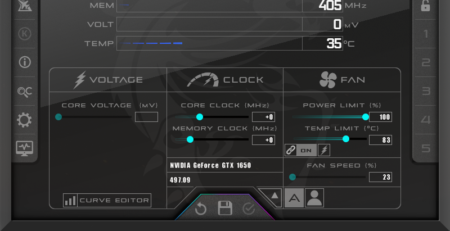
Let’s start examining the driver that comes with MSI Afterburner v.4.6.4.16117 Beta 4. As always, you can find the driver as well as IDA’s project DB and decompiled dispatch function on my GitHub repository.
Driver Analysis
When performing a driver analysis is important to gather the following information:
- Identify the
DriverEntryand determine the IRP dispatch handlers. - Determine if the driver attaches to another device to filter/intercept its I/O requests. If so, what is the target device?
- Determine the
DeviceName. - Identify all the IOCTL codes and their corresponding functionality. Determine what buffering method they use.
- Try to understand how all the pieces fit together.
Loading the RTCore64.sys file in IDA we should be presented with the following block of code:

DriverEntry
IDA is perfectly able to automatically identify the DriverEntry function and, given the fact that this driver is pretty simple, we can also easily recover the DeviceName from this code block.
DeviceName
As you can see from the code flow (Graph overview), from the DriverEntry block there is only one path to follow. The path is directly leading to another block where the IoCreateSymbolicLink Windows API is called. As per Microsoft definition, IoCreateSymbolicLink expect two parameters: SymbolicLinkName and DeviceName (parameters that are clearly marked by IDA).
From a static analysis perspective, in order to extract the DeviceName of more complex drivers is usually enough to “xref” the IoCreateDevice API function call under the “Imports” tab, find its 3rd parameter and trace it back to where it was defined.
While debugging the driver everything will be easier as we will be able to put breakpoints, follow and view registers’ content as well as memory content. It is also the preferred procedure when dealing with heavily obfuscated code (as the DeviceName is usually “stripped” from the string constants or “encrypted”).
Anyway, continuing our analysis we can see that, after the Windows API call, two more functions are present:
- sub_1143c: diving into this sub we can see that the “Graph overview” window explode and that it is a lot more complex and “cryptic” than the
DriverEntryfunction block we were looking at.
For an experienced reverse engineer, inspecting few of the beginning blocks, noticing the graph’s shape (nested if-case/switch-case) and knowing that the function’s address is used to populate some “fields” in the DriverObject structure (look and trace back the rbx register referenced by the following instruction: mov [rbx+70h], rax) could be enough to mark it as a possible Dispatch Routine.
- sub_11008: on the other hand, this sub is almost self-explanatory. Looking at the Windows APIs being called (
IoDeleteSymbolicLink, IoDeleteDevice) we can clearly understand that this function will be called to “destroy” the Driver’s Device; an operation that happens only when the driver is unloaded.
Let’s rename the newly discovered subs with some meaningful names (sub_1143c: DispatchDeviceControl, sub_11008: DriverUnload) and let’s move on.
Dispatch Routine
Let’s cut to the chase, the supposed Dispatch Routine (DispatchDeviceControl function) is indeed the Dispatch Routine in charge to executes different routines based on different IOCTLs that are passed to it through the DeviceIoControl API.
IOCTLs
Examining one of the blocks, following the red line after the first block in the DispatchDeviceControl function, we can see the following lines:
mov eax, dword ptr [rax+(IO_STACK_LOCATION.Parameters+10h)]
mov r8d, 8000202Ch
cmp eax, r8d
ja sub_xxxx
The 32-bit integer checked by the above condition is nothing more than our first IOCTL code.
Something we already know we can decode back to meaningful values:
- IOCTL Code:
0x8000202C - Address:
0x1147A - Device:
0x8000 <UNKNOWN> - Function:
0x80B - Method:
METHOD_BUFFERED - Access:
FILE_ANY_ACCESS
Now, we can manually decode all IOCTLs values we’ll encounter, or we can be “lazy” and employ a cute tool I’ve recently refactored and ported to the latest version of IDA and Python.
Driver Buddy Reloaded
Driver Buddy Reloaded is an IDA Pro Python plugin that helps automate and speed up some tedious Windows Kernel Drivers reverse engineering tasks (you can read more about it and its functionalities on GitHub).
Among the nice functionalities of Driver Buddy Reloaded we will leverage its auto-driver analysis. Using the CTRL+ALT+A shortcut, we’ll launch the driver analysis. It will automatically report back plenty of information.
We are interested in the following bits:
DispatchDeviceControlroutine.- Driver’s DeviceName and symlink.
- Interesting opcodes and Windows APIs usage.
Positioning the cursor in the first block of the discovered DispatchDeviceControl routine, right-clicking and selecting “Driver Buddy Reloaded -> Decode all IOCTls in function” (alternatively using the CTRL+ALT+D shortcut) the following table will appear in the “Output” view.
Driver Buddy Reloaded - IOCTLs
-----------------------------------------------
Address | IOCTL Code | Device           | Function | Method            | Access
0x1147A | 0x8000202C | <UNKNOWN> 0x8000 | 0x80B    | METHOD_BUFFERED 0 | FILE_ANY_ACCESS (0)
0x11492 | 0x80002000 | <UNKNOWN> 0x8000 | 0x800    | METHOD_BUFFERED 0 | FILE_ANY_ACCESS (0)
0x1149D | 0x80002004 | <UNKNOWN> 0x8000 | 0x801    | METHOD_BUFFERED 0 | FILE_ANY_ACCESS (0)
0x114A8 | 0x80002008 | <UNKNOWN> 0x8000 | 0x802    | METHOD_BUFFERED 0 | FILE_ANY_ACCESS (0)
0x114B3 | 0x8000200C | <UNKNOWN> 0x8000 | 0x803    | METHOD_BUFFERED 0 | FILE_ANY_ACCESS (0)
0x114BE | 0x80002010 | <UNKNOWN> 0x8000 | 0x804    | METHOD_BUFFERED 0 | FILE_ANY_ACCESS (0)
0x114C9 | 0x80002014 | <UNKNOWN> 0x8000 | 0x805    | METHOD_BUFFERED 0 | FILE_ANY_ACCESS (0)
0x114D4 | 0x80002018 | <UNKNOWN> 0x8000 | 0x806    | METHOD_BUFFERED 0 | FILE_ANY_ACCESS (0)
0x114DF | 0x8000201C | <UNKNOWN> 0x8000 | 0x807    | METHOD_BUFFERED 0 | FILE_ANY_ACCESS (0)
0x114E6 | 0x80002028 | <UNKNOWN> 0x8000 | 0x80A    | METHOD_BUFFERED 0 | FILE_ANY_ACCESS (0)
0x116F7 | 0x80000000 | <UNKNOWN> 0x8000 | 0x0      | METHOD_BUFFERED 0 | FILE_ANY_ACCESS (0)
0x11727 | 0x80002030 | <UNKNOWN> 0x8000 | 0x80C    | METHOD_BUFFERED 0 | FILE_ANY_ACCESS (0)
0x11732 | 0x80002034 | <UNKNOWN> 0x8000 | 0x80D    | METHOD_BUFFERED 0 | FILE_ANY_ACCESS (0)
0x1173D | 0x80002040 | <UNKNOWN> 0x8000 | 0x810    | METHOD_BUFFERED 0 | FILE_ANY_ACCESS (0)
0x11748 | 0x80002044 | <UNKNOWN> 0x8000 | 0x811    | METHOD_BUFFERED 0 | FILE_ANY_ACCESS (0)
0x11753 | 0x80002048 | <UNKNOWN> 0x8000 | 0x812    | METHOD_BUFFERED 0 | FILE_ANY_ACCESS (0)
0x1175E | 0x8000204C | <UNKNOWN> 0x8000 | 0x813    | METHOD_BUFFERED 0 | FILE_ANY_ACCESS (0)
0x11769 | 0x80002050 | <UNKNOWN> 0x8000 | 0x814    | METHOD_BUFFERED 0 | FILE_ANY_ACCESS (0)
0x11774 | 0x80002054 | <UNKNOWN> 0x8000 | 0x815    | METHOD_BUFFERED 0 | FILE_ANY_ACCESS (0)
All the IOCTLs are conveniently decoded and presented in a table format.
Searching for vulnerable code paths
Looking at the Driver Buddy Reloaded output we are also interested in the potentially dangerous opcodes/Windows API/C++ functions that are listed. They are prime targets for exploitation and some good starting points for our vulnerability research.
Look out for the MmMapIoSpace Windows API, rdmsr and wrmsr opcodes and try to trace them back to their specific IOCTL code (the one reaching their code path).
Eventually, you will discover the following matches:
rdmsr 0x11727 | 0x80002030 | <UNKNOWN> 0x8000 | 0x80C | METHOD_BUFFERED 0 | FILE_ANY_ACCESS (0)wrmsr 0x11732 | 0x80002034 | <UNKNOWN> 0x8000 | 0x80D | METHOD_BUFFERED 0 | FILE_ANY_ACCESS (0)
Now locate the wrmsr code block; it should be easy as clicking on the address showed by Driver Buddy reloaded next to the wrmsr opcode.
[>] Searching for interesting opcodes...
- Found wrmsr in sub_1143C at 0x00011a7c
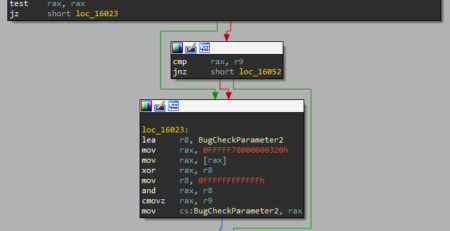
IDA is nice enough to automatically bring you to the right block. Now, set a visible node colour and double click on the arrow pointing to the block; the focus will change, and another node will be shown. Colour it, then proceed tracing back and colouring all the nodes leading to the wrmsr opcode.
At the end you should have something like the following image (Note: the image is edited for editorial purpose as the IOCTL node is too far away from the next one):

Model-Specific Registers (MSRs)
Model-Specific Registers (MSRs) are registers used for toggling or querying CPU info. The wrmsr opcode will write the contents of registers EDX:EAX into the model-specific register (MSR) specified by the ECX register.
The most interesting thing about MSRs is that, on modern systems, the MSR _LSTAR register is used during a system call transition from user-mode to kernel-mode.
The transition from user-mode to kernel-mode can be schematized as follows:
- Syscall.
- Read MSR
_LSTARregister. - Call MSR
_LSTARpointer (Ring-0). - Kernel function handles the syscall logic.
Exposed WRMSR (__writemsr) instruction/wrmsr opcode gives us a pointer overwrite primitive; the _LSTAR register in fact holds a function pointer that is called when any syscall is issued (and it is called from ring-0).
Even if the exploitation phase is out of scope for this article, interested readers could use a toolkit like msrexec, to quickly weaponize this type of vulnerability into full-fledged exploits.
Nice, now that we have the code path leading to the potentially vulnerable opcode, let’s discover if we can exploit it. If any of the input we provide as UserBufferIn is used as a “parameter” for the wrmsr opcode, populating the ECX, EDX, EAX registers we will be able to write to an arbitrary Model-Specific Registers (MSRs) and potentially to achieve a local privilege escalation (LPE) with code execution in the context of the Windows Kernel (ring-0 / NT AUTHORITY\SYSTEM)
Loading the Driver
In order to debug our RTCore64.sys driver, we should use the OSRLOADER by OSR Online tool to create a “service” that can load our driver.
On the debuggee machine, start OSR Driver Loader and configure it as follows:
 Now press the “Register Service” and “Start Service” buttons, we should be greeted back by a dialog message letting us know that the service was started successfully. Double-check that the driver is running with Process Hacker/Process Monitor and WinObj; you should be able to find an
 RTCore64 entry under the GLOBAL?? directory.

Interacting with the Driver
Now that the driver has been loaded and the debugger machine is attached to our WinDbg debugger, you might wonder how we can interact with the driver. Here we have a couple of options: coding our own “C/C++” wrapper to interact with the driver, directly managing IOCTL codes, buffers and Windows API calls or employ a cute little tool I’ve recently refactored and upgraded.
IOCTLpus
IOCTLpus is an open-source C# application that can be used to issue DeviceIoControl requests with arbitrary inputs, with functionality somewhat similar to Burp Repeater.
Start IOCTLpus with Administrator rights and configure it as follows:
- Path/GUID:
\\.\RTCore64 - IOCTL Code:
70000 - Human ACL:
ANY_ACCESS

Now press the “Send” button, we’ll get back a “The parameter is incorrect” error message as the IOCTL code we used is not valid for the RTCore64 driver.
Let’s change it with the code (precedently discovered) that should reach the potentially vulnerable wrmsr opcode: 80002034.
Now, if we press the “Send” button again, the same error message is printed out, why? Let’s find out!
Within WinDbg issue the lmDvmRTCore64 command and locate the RTCore64 entry (note that the addresses showed on your machine will be different due to Windows’ KASLR):
start end module name
fffff804`36cb0000 fffff804`36cba000 RTCore64 (deferred)
The first address is the starting address in memory for our driver, copy it and go to “IDA -> Edit -> Segments -> Rebase Program” and paste the address (remove the backtick ` character, you should have something similar to: 0xfffff80436cb0000). Now you’ve “synced” IDA with the memory space the driver is occupying in the live system, and you’ll be able to use IDA’s addresses to place breakpoints within the debugger.
DispatchDeviceControl
In IDA locate the DispatchDeviceControl routine and retrieve the address of the first compare instruction (FFFFF80436CB146E – cmp byte ptr [rax], 14) use that address to place a breakpoint in WinDbg: bp 0xFFFFF80436CB146E.
Resume the execution and re-issue the request with IOCTLpus, WinDbg should break at the breakpoint, and we should be able to investigate what is causing our request to fail.
If you look at IDA’s graph you’ll see that, from the cmp byte ptr [rax], 14 instruction, two branches begins; if you follow both branches, you’ll see that one end up in a block where the R8 register is compared with an IOCTL code, while the other branch ends up in the very last block of the function and it’s followed by an IofCompleteRequest call.
 From here we can make an educated guess and assume that, if we’re not able to pass the
 cmp byte ptr [rax], 14 check, the driver will terminate its routines and will send back the error message.
IOCTL 80002034
Moving forward, we’ll set a breakpoint at the beginning of the block responsible for handling the wrmsr opcode logic and check if we trigger it. bp FFFFF80436CB1732
 We’ll also update IOCTLpus’s
 UserBufferInput with an easily recognizable pattern and press “Send”:
In this way, if any of our buffer’s fields will be loaded inside memory or a register will be easier to spot.
As soon as we hit the breakpoint, we’ll be able to see some interesting values being loaded into the registers:
- RAX: contains the IOCTL code we’ve passed to the
DeviceIoControlrequest. - RDX: contains the size of our
UserBufferInput(20h). - RBX: contains a pointer to our
UserBufferInput; dereferencing RBX will show us the content of our buffer:
dd @rbx
ffff8086`e24f00c0 41414141 42424242 43434343 44444444
ffff8086`e24f00d0 45454545 46464646 47474747 48484848
- R9: contains the size of our
UserBufferOutput(20h).
Ok, let’s step forward and check if we “land” into the block handling the wrmsr opcode logic.
UserBufferIn – Requirements and Constraints
Some instructions later we can see that the content of the EDX register is compared to the immediate value of Ch; as RDX contains the size of UserBufferInput we should update its size, to pass this check.
 At this point, we should see that the first field of our buffer is loaded into
 ECX: mov ecx, [rbx].
A copy of ECX’s value is stored into EAX before 174h is subtracted to it: lea eax, [rcx-174h].
Then, the result is compared with the value of 2; if the result is <= 2, we’ll exit the routine:
cmp eax, 2
jbe short loc_FFFFF80436CB1A99
As the content of our first field is 41414141h - 174h = 41413fcdh >= 2 execution proceeds without any trouble. At this point another set of operations is performed: EAX is loaded with the result of the addition between the content of ECX and the value 3FFFFF80h. We’ll exit the routine if the result is <= 4. Again, we do not have any trouble with this requirement as 41414141h+3FFFFF80h=814140c1h.
As pointed out by @AlexUnwinder on Twitter (hat tip), the precedent two arithmetical operations will act as a blacklist for the MSR address ranges: 0x174-0x176 and 0xC0000080-0xC0000084; the 0x3FFFFF80 value is nothing more than -0xC0000080, transforming the compiler optimised code from lea eax, [rcx+3FFFFF80h]into the equivalent sub eax, 0xC0000080 operation.
wrmsr opcode
Now we are into the last block of code of this routine:
Here the registers are loaded in order to act as a “parameters” for the wrmsr opcode. If we break before the wrmsr instruction, we’ll be able to see the content of all the registers we’re interested in:
edx=42424242
eax=43434343
ecx=41414141
The wrmsr opcode will write the contents of registers EDX:EAX into the 64-bit model-specific register (MSR) specified by the ECX register. The content of the EDX register is copied to high-order 32 bits of the selected MSR and the content of the EAX register is copied to low-order 32 bits of the MSR. On processors that support the Intel 64 architecture, the high-order 32 bits of RAX, RCX, RDX are ignored.
Exploitability and Conclusions
We can clearly control all the “parameters” of the wrmsr opcode but, unfortunately, we cannot overcome the restriction in place; preventing us from loading the 0xc0000082 (MSR Long System Target-Address Register – LSTAR) value into the ECX register. If anyhow, we would have been able to do so, we would have obtained arbitrary code execution in the context of the Windows Kernel (ring-0 / NT AUTHORITY\SYSTEM).
You can still test it, crashing the VM, manually forcing the ECX register value after the check is passed. However, on a VM, you might encounter various troubles:
- The hypervisor could actively filtering MSRs read/write operations.
- You might have Virtualization Based Security (VBS) turned on.
That’s why I’ll always suggest confirming exploitability against a physical machine set up once you’ve discovered a possible vulnerability.
 If you remember, we also had to execute IOCTLpus as Administrator before being able to interact (getting a handle) with the driver, this restriction further thwart our Local Privilege Escalation (LPE) exploit.
The debate on “Is Admin to Kernel a security boundary?” is left as homework for the reader.
Bonus Exercise
If you’d like to experiment a bit more with this driver and improve your reverse engineering skill, try to understand the logic of the block containing the MmMapIoSpace function call; it’s a bit more complex than the previous example but it’s a good exercise.
- What IOCTL code is needed to reach the
MmMapIoSpacecode block? - What are the requirements, constraints and limitations imposed to the
UserBufferInput? - What is the definition of the
MmMapIoSpaceAPI? What are its parameters? - What is being used as parameters for the
MmMapIoSpaceAPI? What’s its calling convention? What registers we control? Can we load them with any value we like? - Can it be weaponized into an arbitrary memory read primitive?
- Yes? Then write an exploit for it :).
- No? What are the limitations that thwart the exploitation?
Hints
- IOCTL code for
MmMapIoSpaceAPI0x80002040. MmMapIoSpaceAPI definition (MSDN).
PVOID MmMapIoSpace(
  [in] PHYSICAL_ADDRESS    PhysicalAddress,
  [in] SIZE_T              NumberOfBytes,
  [in] MEMORY_CACHING_TYPE CacheType
);
- Windows x64 Calling convention:
fastcall. The first four (4) function arguments are passed in theRCX, RDX, R8, and R9registers; the rest of the parameters, if any, is passed on the stack.
Resources & References
- MSI Afterburner Advisory
- Defining I/O Control Codes
- Driver Attack Surface
- Methodology for Static Reverse Engineering of Windows Kernel Drivers
- Practical Reverse Engineering: x86, x64, ARM, Windows Kernel, Reversing Tools, and Obfuscation book
- Abusing Token Privileges for LPE
- Device Driver Debauchery and MSR Madness – Ryan Warns, Timothy Harrison – INFILTRATE 2019
- Exploiting System Mechanic Driver
- Reverse Engineering & Exploiting Dell CVE-2021-21551
- Root Cause Analysis of a Printer’s Drivers Vulnerability CVE-2021-3438
- Crucial’s MOD Utility LPE – CVE-2021-41285
- MSI ntiolib.sys/winio.sys local privilege escalation
- CVE-2020-12928 Exploit Proof-of-Concept, Privilege Escalation in AMD Ryzen Master AMDRyzenMasterDriver.sys
- @HackSysTeam
- ESET Signed Kernel Driver