Driver Buddy Reloaded
As part of my continuous security research journey, during this year I’ve spent a good amount of time reverse-engineering Windows drivers and exploiting kernel-mode related vulnerabilities.
While in the past there were (as far as I know), at least two good IDA plugins aiding in the reverse engineering process:
- DriverBuddy of NCC Group.
- win_driver_plugin of F-Secure.
unfortunately, nowadays, they are both rusty, out of date and broken on the latest version of IDA. They relied on external dependencies, were lacking documentation and in general, they are obsolete.
So, I’ve started developing an internal tool to speed up Windows drivers reverse engineering and security testing efforts. I’m excited to announce that Driver Buddy Reloaded is now available on GitHub.
This blog post is a re-post of the original article “Driver Buddy Reloaded” that I have written for Yarix on YLabs.
Table of Contents
About Driver Buddy Reloaded
Driver Buddy Reloaded is an IDA Pro Python plugin that helps automate and speed up some tedious Windows Kernel Drivers reverse engineering tasks.
All of its code has been reworked and updated from Python 2 to Python 3, IDA APIs usage has been upgraded supporting IDA 7.x, a list of potentially vulnerable functions and opcodes has been integrated, all external and outdated dependencies were removed, and interesting functionalities present in the above-mentioned plugins were integrated. The code is far from perfect, some functions are a bit hacky and, in general, the plugin employs some experimental and heuristic features but anyone is welcome to improve it.
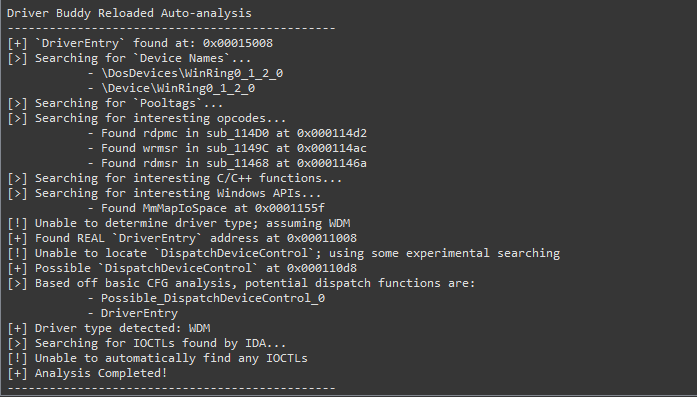
Driver Buddy Auto-analysis
Once the plugin is in place into IDA’s plugin folder, accessing the Driver Buddy Reloaded menu (Edit -> Plugins -> Driver Buddy Reloaded) or pressing CTRL+ALT+A will start the auto-analysis.
Finding DispatchDeviceControl
The tool can automatically locate and identify the DispatchDeviceControl routine. This function is used to route all incoming DeviceIoControl codes to the specific driver function associated with that code. Automatically identifying this function makes finding the valid DeviceIoControl codes for each driver much quicker. Additionally, when investigating possible vulnerabilities in a driver due to a crash, knowing the location of this function helps narrow the focus to the specific function call associated with the crashing DeviceIoControl code.
When the analysis is successful some subs will be renamed as follow:
DriverEntry: the original first driver-supplied routine that is called after a driver is loaded. It is responsible for initializing the driver.Real_Driver_Entry: usually the function where the execution fromDriverEntryhas been transferred to. It is usually where theDeviceNameis initialized.DispatchDeviceControl/DispatchInternalDeviceControl: if the tool was able to recover the functions at some specific offsets, the functions will then be renamed with the appropriate name.Possible_DispatchDeviceControl_#: if the tool was not able to recoverDispatchDeviceControlorDispatchInternalDeviceControl, it employs an experimental searching, following the execution flow, and checking for cases where the function is loading knownIO_STACK_LOCATION&IRPaddresses; indicating that the function could be theDispatchDeviceControl. As it is based on heuristic, it could return more than one result, and it is prone to false positives.

Labelling WDM & WDF Structures
Several driver structures are shared among all WDM/WDF drivers. The tool is able to automatically identify these structures, such as the IO_STACK_LOCATION, IRP, and DeviceObject structures and can help save time during the reverse engineering process and provide context to areas of the driver where these functions are in use.

Finding & Decoding IOCTL Codes
While reversing drivers, it is common to come across IOCTL codes as part of the analysis. These codes, when decoded, reveal useful information and may draw focus to specific parts of the driver where vulnerabilities are more likely to exist.
By right-clicking on a potential IOCTL code, a context menu option is presented (alternatively using the Ctrl+Alt+D shortcut when the cursor is on the line containing a suspected IOCTL code) and can be used to decode the value. This will print out a table with all decoded IOCTL codes. By right-clicking on a decoded IOCTL code, in the disassembly view, it’s possible to mark it as invalid; this will leave any non-IOCTL comment intact.
If you right-click on the first instruction of the function you believe to be the IOCTL dispatcher (DispatchDeviceControl/DispatchInternalDeviceControl/Possible_DispatchDeviceControl_#) under the Driver Buddy Reloaded menu, a “Decode All” option appears, this attempt to decode all the IOCTL codes it can find in the function. This is a bit hacky but most of the time it can speed things up.


Flagging Functions
Driver Buddy Reloaded has a list of C/C++ functions and opcodes as well as Windows API that are commonly vulnerable or that can facilitate buffer overflow conditions. All found instances are reported back during the auto-analysis and can help while looking for possible user-controlled code paths reaching sensitive functions.

Finding Device Names
The tool automatically attempts to find the drivers registered device paths (DeviceName), if no paths can be found by looking at Unicode strings inside the binary, then the analyst can manually try to use Madiant’s FLOSS in an attempt to find obfuscated paths.
![]()
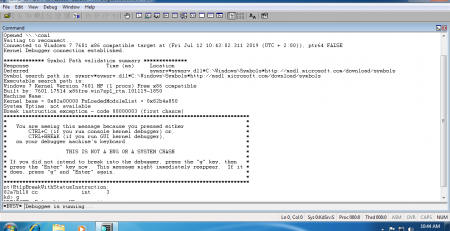
Dumping Pooltags
During the auto-analysis, the tool also dumps the Pooltags used by the binary in a format that works with pooltags.txt. The output can then be copy-pasted at the end of the file and later picked up by WinDbg.